A year ago last week I got a Fitbit Flex. I have worn it every day since, which means that with a few exceptions when I inadvertently let the battery die, it has tracked every step I’ve taken.
This wasn’t much of a chore, because the device itself mostly stays out of my way. The battery life is solid; I only charge it every five or six days. The fact that it’s mostly waterproof also helps. It stays on in the shower, and I’ve swum with it in both salt and fresh water with no issues.
Having a daily goal – 12,000 steps, in my case – helps incent good behaviors. Taking the stairs instead of an escalator. Walking to lunch instead of driving. And, much to the frustration of the occasional passenger, parking as far away from a store as its parking lot allows.
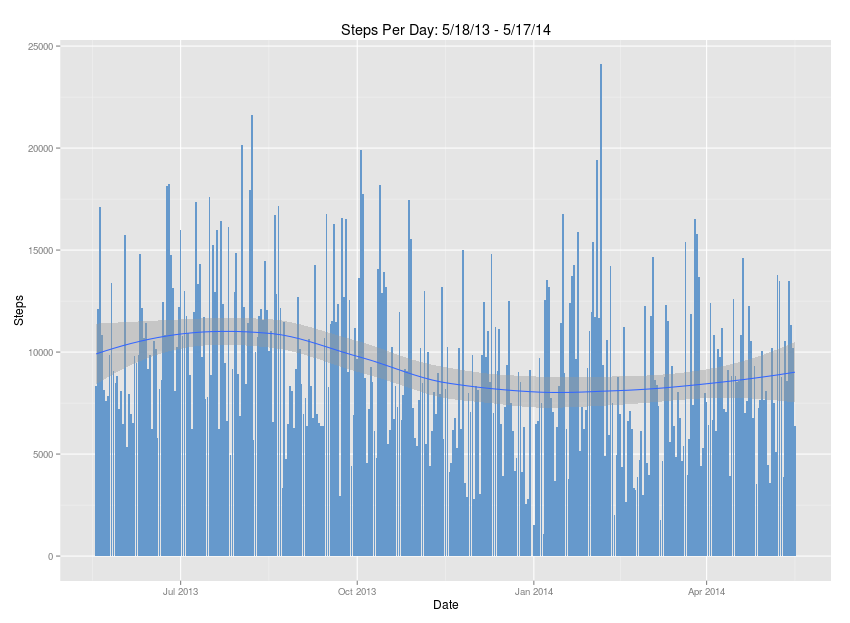
While the daily numbers are useful, however, zooming out to look at the data over longer periods of time is illuminating. The chart above depicts a year’s worth of steps.
Over the calendar year plus I’ve averaged 9,340 steps. Which is shy of my 12,000 step goal, but not that far from the 10,000 commonly recommended. It’s also easy to spot patterns in the data that aren’t as obvious when your focus is day to day: greater activity in the summer, with a decline in the winter and during the spring conference season. Theoretically the weather shouldn’t have a huge impact on my activity level thanks to the tread-desk I have at the office, but when the winter is bad enough that I can’t even get there – like this winter, it shows up in the data.
A third of consumers, reportedly, abandon devices like the Fitbit after purchasing them. A year in, I can’t imagine doing that. Just as it’s interesting to look back on a year to examine month to month trends, I’m hoping to be comparing year-to-year trends eventually.
For now, though, I’ll have to work on picking the activity back up so that this summer’s data looks like last’s.
